Decision tree analysis is a popular method used in business, finance, and other fields to evaluate the potential outcomes of a decision
This helps to choose the option that is most likely to lead to a positive result. It involves creating a visual representation of the decision-making process in the form of a tree, with branches representing the different options available and the potential outcomes of each option.

To create a decision tree, you will need to start by identifying the decision that needs to be made and the possible options available. Next, you will need to consider the potential outcomes of each option and assign a value to each outcome. This can be based on factors such as financial gain or loss, customer satisfaction, or any other relevant metric.
Once you have identified the options and outcomes, you can create the decision tree. Start by drawing a vertical line representing the decision and branches defining the options. Then, add branches for the potential outcomes of each option. You can use labels or numbers to represent the values assigned to each outcome.
To analyze the decision tree, you will need to consider the potential outcomes of each option and choose the one that is most likely to lead to the best result. This can be done by calculating the expected value of each option, which is the sum of the values of each potential outcome multiplied by the probability of that outcome occurring. The option with the highest expected value is generally the best choice.
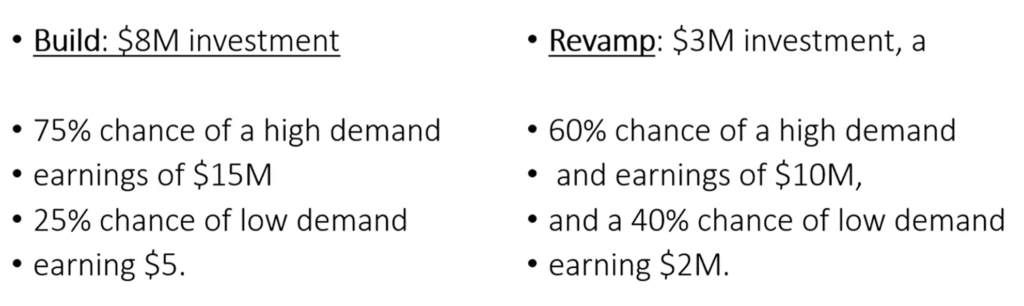
As an example of how decision-tree analysis is performed, suppose a customer wishes to decide whether to build an amusement park from scratch or to purchase an existing one and revamp it. In this scenario, building an amusement park will cost an initial investment of $8 million. A poll of the local population indicates that there is a 75% chance of high demand for a new park, which will earn $15 million for the customer, and a 25% chance of low demand for a new park which will only make $5 million (Figure 1). Furthermore, purchasing and revamping an existing amusement park will cost the customer an initial investment of $3 million. A poll of the local population indicates a 60% chance of a high demand for the existing park, earning $10 million for the customer, and a 40% chance that there will be a low demand for an existing park and only make $2 million. A decision-tree analysis is an excellent way to determine the best result.
Step 1: The first step in the decision-tree analysis is to create a box on the left side of a sheet of paper or dry-erase board, with two choices, build or revamp (Figure 2). To the right of the build-or-buy box, the first branches are created, with the build decision at an initial investment of $8 million at the top and the buy decision, with an initial investment of $3 million at the bottom. The green box is used to depict a “decision node.”
Step 2: The next step is to create branches for the build decision. In this case, to the right and top of the build decision, a box is made with a strong demand of 75%, with an estimated monetary value (EMV) of $15 million. Below the strong-demand box, a weak-demand box is created, with an EMV of $5 million. The red circles in the diagram (Figure 2) denote “chance icons,” while the purple triangles denote the “decision outcomes.”
Step 3: After creating branches for the build decision, the same process is performed for the revamp decision. The top branch for the buy decision is the strong demand of 60% and a potential EMV of $10 million. The bottom branch is the weak demand of 40%, with an EMV of $2 million.
Step 4: The next step is to perform some simple math. Beginning with the build decision-strong demand, subtract the initial investment (INV) of $8 million from the EMV of $15 million, then multiply the new number by 75% [($15 m – $8 m) * 0.75] (Figure 3). The result of the strong demand branch is $5.25 million. Perform the same steps for the weak demand branch by subtracting the INV from the EMV, then multiplying it by the demand percentage [($5 m – $8 m) * 0.25] to get -$750,000. Lastly, add the build, strong and weak demands together ($5.25 m) + (-$750k) to get a grand total of $4.5 million for the build decision.
Step 5: Go to the revamp decision box and perform the same steps (Steps 1-4) for the build decision box (Figure 4). The revamp decision, strong demand formula becomes ($10 m – $3 m) * 0.60, with a result of $4.2 million. The revamp decision, weak demand formula becomes ($2 m – $3 m) * 0.40, with a result of $3.8 million.
Now that the hard part is over determining which decision, build or revamp, is the best for the customer. Just compare the $4.5 million in potential profits for the build decision to the $3.8 million to revamp. The better choice for the customer is to build a new amusement park from scratch.
In addition to helping you make informed decisions, decision tree analysis can also help identify potential risks and uncertainties and develop contingency plans to mitigate them. It can also help compare different options and evaluate their relative strengths and weaknesses.
Overall, decision tree analysis is a powerful tool that can help businesses and organizations make more informed and strategic decisions. By carefully considering the potential outcomes of each option and choosing the one that is most likely to lead to success, decision tree analysis can help organizations achieve their goals and maximize their resources.